2012 US Migration

Restless America: state-to-state migration in 2012 | vizynary.

Approximately 7.1 million Americans moved to another state in 2012. That’s over 2.2% of the U.S. population.

Where did they come from?  Where did they go?  Take a look!

allmigrate

What about Texas?  We hear there are 500 people a week moving to Austin.  Does this match the data from the census bureau?

texas

500 a Week to Austin is 26,000.  That leaves another 80,000 people who moved someplace else in Texas – Houston, El Paso, Lubbock?  Where are they?  What kind of jobs will they find?  What skills will they need?  How will we pay to educate their children, pave their roads, provide their water?

Giants Arrows

The Forgotten Giant Arrows that Guide you Across America | Messy Nessy Chic Messy Nessy Chic.

So if you are in an airplane and get lost, just look for these!

Originally poured to guide airmail planes, few are left.

They had a tower with rotating beacon light, a generator shack, and a small hut for the ‘keeper.’

They were placed every 10 miles across the US, but no one knows how many are left.

Here’s a link to one of the giant arrows on Google maps as well as a website listing the original locations of Eastern and Western beacons, siting which ones have been found/ destroyed/ preserved etc.

Happy hunting!

‘First time’ in history


‘First time’ in history: White deaths outnumber births in US — RT USA.

Deaths of white people outnumbered births for the very first time in US history, the Census Bureau revealed Thursday. The census predicts The Census Bureau also says that that significant drops in birth rates v death rates will be regular by 2025.

The study says that half of the under 5 age group is now racial and ethnic minorities.  Things are changing here, and those changes will have a huge impact on our future as a nation.

“More so than ever, we need to recognize the importance of young minorities for the growth and vitality of our labor force and economy,” Frey added. “Last year, we saw the majority of babies are minorities. Now we see more whites are dying than being born. Together, that tells us a lot about where we’re going as a country.”

Borderlines


A ‘Whom Do You Hang With?’ Map of America : Krulwich Wonders… : NPR.

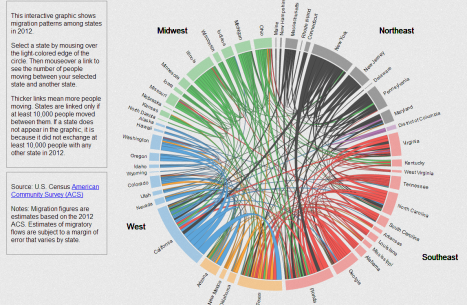
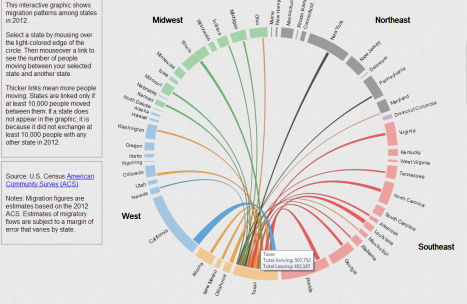
Ever since the borders of our 50 states were drawn so many years ago cultural geographers  have been trying to figure out if they reflect who we are, or if they are just arbitrary lines on a map.  Well, here are some answers.

[these] hunk[s] of America, in his view, is now an “effective community,” a place where people-to-people business has a distinct flavor, distinct from neighboring regions. In other words, it’s its own neighborhood.

California’s “neighborhood” includes Arizona and much of Nevada.

The above map is based on WheresGeorge.com data.  This website, where you can enter the serial number of the bills in your wallet, and then watch as they travel around the country, shows several distinct “neighborhoods.”

In the Seattle area, for example, his team found that over two weeks, only 7.8 percent of the bills moved more than 500 miles away. Most of the money stayed close. More interestingly, Dirk’s team began to notice virtual borders, lines that the money rarely crossed. In this map, you can see the territory marked by the Canadian border to the north, a bit of California at the southern end, and Idaho to the east. Oregon and Washington seem undifferentiated. But at the edges, a blue border seems to capture and contain most of the cash (and the people?) moving within. Those lines, Dirk marked deep blue.

Another map, by some folks at MIT, uses anonymous AT&T data.

This map shows different, but equally ‘unstate-like’ borders.

Will we remain the 50 states forever?  Or will our borders change to reflect the changing demographics of this country?

Infant Mortality – We’re 40th out of 180

via U.S. newborn death rate higher than in 40 other nations – USATODAY.com.

Published on Tuesday in the journal PLoS Medicine, the study shows that babies under 4 weeks old account for 41 percent of child deaths worldwide.

Although the article doesn’t discuss reasons that the US rate is higher, it does say

“It’s not that things are worse in the United States than before, it’s that the U.S. isn’t making progress like other countries,” Lawn said.

Because of improvements in infant care in some countries, newborns in Qatar, Croatia and the United Arab Emirates now die at about the same rate as those in the United States, the figures show.

In 1990 the United States had the 28th lowest risk.

The leading causes of infant death are preterm delivery, asphyxia, and severe infections.  Developing nations have been able to provide better prenatal care, and thus have increased the survival rate of infants.  But according to the article, African nations still have a ways to go:

“Training more midwives and other community health workers could save the lives of many more babies,” she said. “We know that solutions as simple as keeping newborns warm, clean and properly breast-fed can keep them alive.”

  • Archives